Exploring Seattle Crime

Santino Iannone, Christine Dien, Zachary Nachod


Locate a Seattle Neighborhood

Police departments across the United States have become an increasingly significant topic talked about in political, social, and educational environments. In the past year there has been public outcry, protest, and defense for law enforcement resulting from recent events related to police brutality.

However, it hasn’t been just this past year where problems related to law enforcement have been prominent, it's been building up for decades. Our project intends to give insight into how to properly structure SPD resources based on Seattle crime data from 2008 to the present. Our visualizations attempt to show data and evidence to support a conclusion the reader may come up with in the most neutral form possible. We will focus on how crime in Seattle has evolved with regards to its location, type, and frequency. These parameters can inform how to more effectively reinvest resources to reflect the observed crime distribution.

The visualization to the right is a map of the city of Seattle divided into its respective neighborhoods. The map is interactive and can be used to find out where neighborhoods are located to give context to the data below. The data shown on the map is from the Seattle Police Department Records Management System (RMS).

SEATTLE


Which neighborhood has the highest percentage of total crime?

On the map to the left, each neighborhood in Seattle is colored according to the percentage of total Seattle crime that it comprises. The color bar on the right describes what each color corresponds to.

We can see that the Downtown / Commercial beat has the highest percentage of total crime, with over 8% of all Seattle Crime.


Where does each type of offense occur the most?

This table details where each type of offense is occurs the most. This information can help inform how and where to reinvest SPD resources to better suit the needs of each neighborhood.

Some takeaways are:

  • Fraud occurs the most in the Northgate.
  • Family Offenses, Nonviolent most in Sandpoint
  • We see Bad Checks offenses the most in Capitol Hill

  • These nonviolent offenses may not require SPD to arrive in a way or use items that may escalate these situations.


    How do different Seattle neighborhoods compare to the rest for each offense type?

    The heatmap to the left visualizes how the offense count for each neighborhood compares to the mean of all neighborhoods for different types of crime.

    For example, compared to other neighborhoods, we see that Capitol Hill has high levels of Bribery.

    Additionally we can deduct that Downtown / Commercial has higher than average levels of Gambling Offenses.

    To explore these trends further, use the following interactive visualizations to filter by Offense Type and see the offense counts per neighborhood. Or you can filter by neighborhood and see the offense counts per crime type.


    How does each year from 2008 to 2020 compare to each other per offense type?

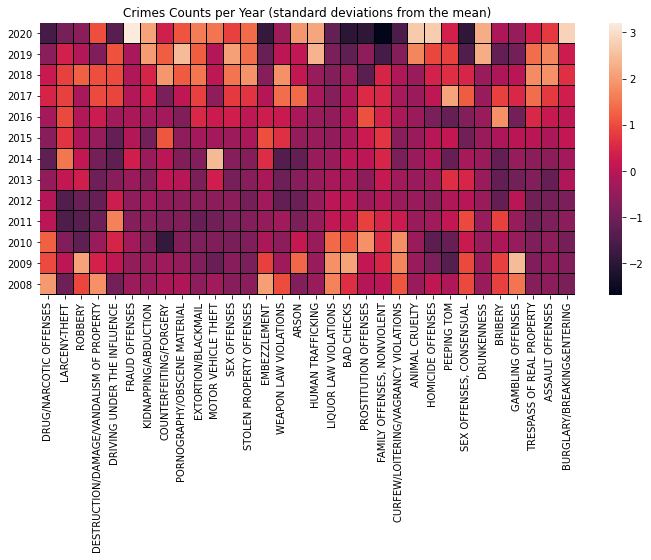
    The heatmap to the left visualizes how the offense count for each year from 2008 to 2020 compares to the annual average across all years for each crime type.

    For example, we see that the year 2020 has especially high levels of Fraud Offenses compared to other years. This may be reflective of the worldwide COVID-19 pandemic. Interestingly, we see that 2020 had less Family Offenses, Nonviolent compared to the mean offense count for this type of crime across all years.

    We can also see that that 2008 has higher than average levels of Embezzlement and Gambling Offenses. These trends may reflect the 2008 Financial Crisis.

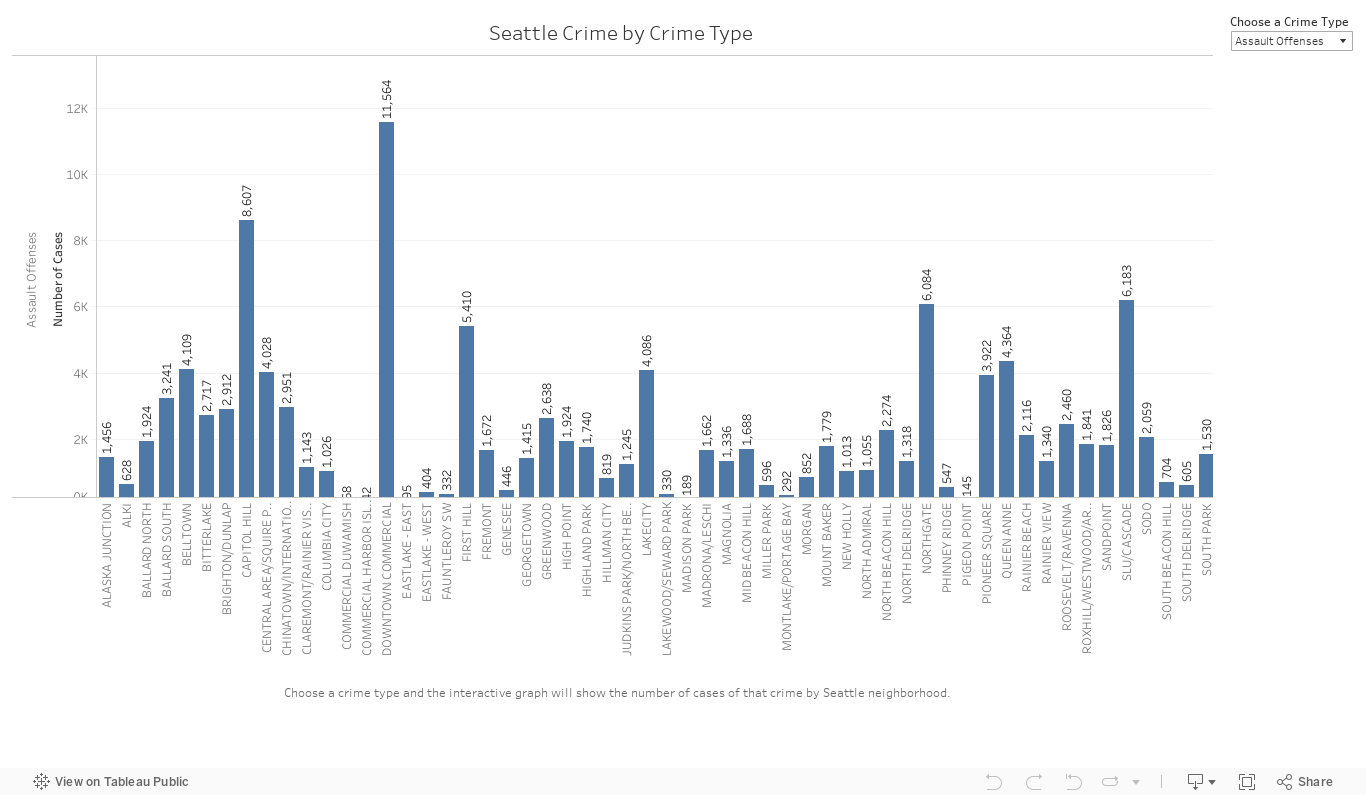
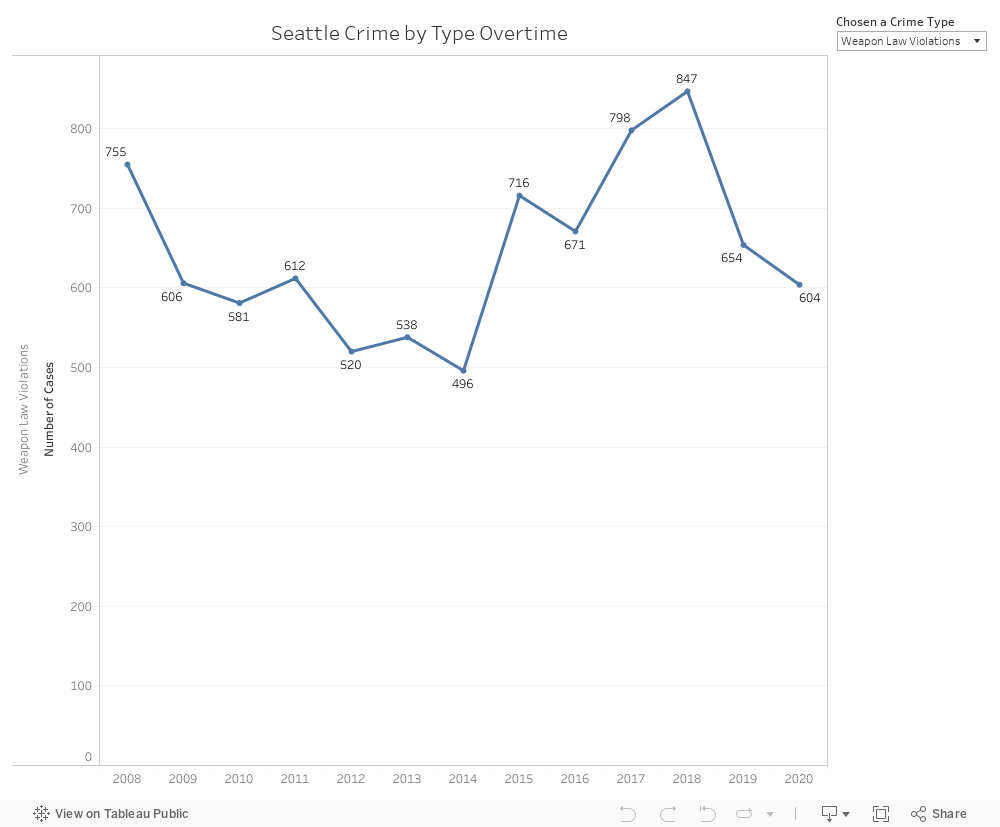
    To explore more trends over time, use the following interactive visualization to filter by Offense Type to see how offense counts change over time.


    2020 Seattle Police Department Adopted Budget

    The bar plot to the left shows us the breakdown of the 2020 SPD budget, based on the different departments.

    We can see that spending on Precincts is the highest compared to other departments. We can also see that spending on Police Accountability is quite low.


    Conclusions


    Using the provided data visualizations on this website in conjunction with the actual 2020 Seattle Police Department budget shown above, the user can come to their own conclusion about what part of the police budget needs reformation. From our observations the budget for Police Accountability and other non-violent departments in the current 2020 Seattle Police Department budget is too low in comparison to the budget given for precincts. This is due to the spread of crime seen in the interactive bar charts overtime trending towards non-violent crimes such as fraud in some areas. However, we do agree that precincts and violent crimes have a current justified budget in a select few neighborhoods due to the high level of violent crimes. Overall, we hoped to present the user with the tools and information needed for them to explore the distribution of crime in Seattle. They will be able to come to their own conclusions about whether the Seattle Police Department budget accurately reflects the needs of the current Seattle communities.


    Data Sources